Статья:


MODERN TRENDS IN TRADE AND INVESTMENT COOPERATION BETWEEN RUSSIA AND CHINA
Конференция: CCCLXIV Студенческая международная научно-практическая конференция «Молодежный научный форум»
Секция: Экономика
Выходные данные
Guseva V., Ilina A. MODERN TRENDS IN TRADE AND INVESTMENT COOPERATION BETWEEN RUSSIA AND CHINA // Молодежный научный форум: электр. сб. ст. по мат. CCCLXIV междунар. студ. науч.-практ. конф. № 38(364). URL: https://nauchforum.ru/archive/MNF_interdisciplinarity/38(364).pdf (дата обращения: 21.11.2026)
Лауреаты определены. Конференция завершена
Эта статья набрала 0 голосов
Мне нравится0
Дипломы
лауреатов
лауреатов
Сертификаты
участников
участников
Дипломы
лауреатов
лауреатов
Сертификаты
участников
участников


CCCLXIV Студенческая международная научно-практическая конференция «Молодежный научный форум»
MODERN TRENDS IN TRADE AND INVESTMENT COOPERATION BETWEEN RUSSIA AND CHINA
Guseva Veronika
student, Saint Petersburg State University, Saint Petersburg, Russian Federation
Ilina Anastasiia
graduate of Saint Petersburg State University, Saint Petersburg, Russian Federation
Abstract. In this article we examine the modern trend in the development of cooperation between Russia and China. The main fields are trade and investment, which are very significant for consideration. We have studied the dynamics of trade turnover between Russia and China, created its forecast, and compared it with the expected estimate. The paper also considers the essential focus of Chinese investment. It is also concluded that a transition from predominantly raw-material-based cooperation towards joint production, technological exchange, and the development of processing industries is necessary for more sustainable bilateral cooperation.
Keywords: Russia; China; trade turnover; foreign trade; foreign direct investment; forecasting; export structure; bilateral cooperation.
Russia reoriented its foreign economic activity towards the East after 2022. Despite the fact that from Donald Trump’s point of view Russia would be a great partner against China, Russia continues to give preference to cooperation with China, believing it to be more reliable and stable.[3] Cooperation covers several key fields.
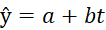
First, Russian experts have set a goal of increasing trade turnover between Russia and China to $300 billion by 2030.[5] We have calculated the forecast value of this trade turnover using the following formula:
 ;
 ;
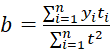 ,
where ŷ is the forecast value of trade turnover between Russia and China in year t, $billion; a is the intercept; b is the slope coefficient; t is the time variable; n is the number of observations.
According to the linear model, the projected trade turnover between Russia and China in 2030 will be approximately $256 billion, which is $44 billion below the $300 billion target. Achieving this goal would require an average annual growth rate exceeding that observed between 2007 and 2025. This may be possible given strong growth in energy exports, expanded cooperation in machinery and investment, and a reduction in infrastructure-related and sanctions-imposed constraints. The calculated statistics are presented in Table 1.
Table 1.
Trade turnover between Russia and China, billion dollars
|
Year |
Trade turnover |
t |
t^2 |
yt |
ŷ |
y-ŷ |
(y-ŷ)^2 |
|---|---|---|---|---|---|---|---|
|
2007 |
39,58 |
-9,00 |
81,00 |
-356,22 |
18,83347 |
20,75 |
430,42 |
|
2008 |
55,92 |
-8,00 |
64,00 |
-447,36 |
29,15028 |
26,77 |
716,62 |
|
2009 |
39,53 |
-7,00 |
49,00 |
-276,71 |
39,46709 |
0,06 |
0,00 |
|
2010 |
58,74 |
-6,00 |
36,00 |
-352,44 |
49,78389 |
8,96 |
80,21 |
|
2011 |
82,73 |
-5,00 |
25,00 |
-413,65 |
60,1007 |
22,63 |
512,09 |
|
2012 |
87,54 |
-4,00 |
16,00 |
-350,16 |
70,41751 |
17,12 |
293,18 |
|
2013 |
88,80 |
-3,00 |
9,00 |
-266,4 |
80,73432 |
8,07 |
65,06 |
|
2014 |
88,26 |
-2,00 |
4,00 |
-176,52 |
91,05112 |
-2,79 |
7,79 |
|
2015 |
61,39 |
-1,00 |
1,00 |
-61,39 |
101,3679 |
-39,98 |
1 598,23 |
|
2016 |
66,11 |
0,00 |
0,00 |
0 |
111,6847 |
-45,57 |
2 077,06 |
|
2017 |
86,96 |
1,00 |
1,00 |
86,96 |
122,0015 |
-35,04 |
1 227,91 |
|
2018 |
108,26 |
2,00 |
4,00 |
216,52 |
132,3184 |
-24,06 |
578,80 |
|
2019 |
110,92 |
3,00 |
9,00 |
332,76 |
142,6352 |
-31,72 |
1 005,85 |
|
2020 |
104,06 |
4,00 |
16,00 |
416,24 |
152,952 |
-48,89 |
2 390,42 |
|
2021 |
141,37 |
5,00 |
25,00 |
706,85 |
163,2688 |
-21,90 |
479,56 |
|
2022 |
190,27 |
6,00 |
36,00 |
1141,62 |
173,5856 |
16,68 |
278,37 |
|
2023 |
239,54 |
7,00 |
49,00 |
1676,78 |
183,9024 |
55,64 |
3 095,54 |
|
2024 |
244,57 |
8,00 |
64,00 |
1956,56 |
194,2192 |
50,35 |
2 535,20 |
|
2025 |
227,46 |
9,00 |
81,00 |
2047,14 |
204,536 |
22,92 |
525,51 |
|
Total |
- |
- |
570,00 |
5880,58 |
- |
- |
- |
Source:[7]
It should be noted that the linear model describes the long-term trend only approximately as the coefficient of determination is 0,77 and the standard error of the regression is about $32 billion, so the model captures the general upward movement of trade turnover but not its sharp fluctuations. The residuals in Table 1 are negative for 2014 – 2021 and positive for 2022 – 2025. This phenomena indicates a structural break after 2022, turnover grew much faster than the long-term trend, but in 2025 it decreased by about 7 %, from $244,57 billion to $227,46 billion. Moreover, to reach the target of $300 billion by 2030, turnover would have to increase by roughly $14,5 billion per year in 2026-2030, whereas the slope of the estimated trend is only $10,3 billion per year. Consequently, the forecast of $256 billion should be regarded as a baseline scenario that reflects the historical trend rather than the effects of recent changes in bilateral trade.
Attention should be also paid to the structure of trade turnover. There is a dominant share of oil, coal, petroleum products, and gas in Russian exports to China. These goods account for approximately 60 % of total exports. Moreover, Russia increased its exports of ores and metals to China in 2025. At the same time, China generally exports industrial equipment, machinery, electronics, automobiles and their components to Russia. Thus, there is a structural asymmetry in bilateral trade. Russia exports resources that require further processing, while China exports high-value-added goods. [6]
The structure of trade also explains the instability of its dynamics. Because energy resources and raw materials dominate in Russian exports, trade turnover is highly sensitive to world commodity prices and to the demand of the Chinese economy. This is confirmed by the data in Table 1, namely turnover fell by about 29 % (from $55,92 billion to $39,53 billion) during the global financial crisis in 2009, and it fell by about 30 % (from $88,26 billion to $61,39 billion) following the decline in oil prices in 2015. Thus, growth of turnover based mainly on raw-material exports is vulnerable to external shocks and does not create conditions for long-term technological development.
Regarding investment cooperation, it is important to note that the stock of Chinese FDI in Russia had increased to almost $16 billion by 2024.[4] This can be explained by the fact that, after 2022, many European companies left the Russian market and vacated niches in the automotive industry, logistics, electronics, real estate, and industrial equipment. These niches were subsequently occupied by Chinese manufacturers and investors.
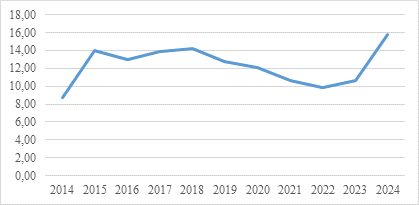
Figure 1. FDI from China to Russia
In addition, it is necessary to mention Russian-Chinese investment index, which is calculated quarterly by A1, a major Russian investment firm, and the National Coordination Center for International Business Cooperation (NCC). The index is calculated based on an analysis of the current operations of companies with Chinese capital in various Russian regions, as well as an assessment of the investment attractiveness of those regions themselves. According to the index, the Amur Oblast, Moscow, and the Jewish Autonomous Oblast remain the most attractive regions for Chinese investment.[1] In Moscow and the Moscow Region, China primarily invests in trade, construction, real estate, and logistics. The Amur Region attracts Chinese investment through its agriculture, mineral extraction, industrial facilities under construction, and developing infrastructure. Furthermore, the region serves as a major trade hub, hosting a large number of Chinese companies engaged in commercial activities. The Jewish Autonomous Region is of interest to Chinese investors due to projects in its local agricultural sector, which accounts for a significant share of the region’s gross regional product. In addition to investments in agriculture, Chinese businesses have also shown a particular interest in the forestry sector.[2]
It is also important to consider the sectoral structure of Chinese investment. It is concentrated mainly in trade, construction, real estate, logistics, agriculture, and the extraction of natural resources, that is, in sectors with relatively quick returns and limited technology transfer. At the same time, investment in the industries that could reduce the structural asymmetry of trade, for instance, manufacturing and high-technology industries, remains less preferable. In addition, Chinese investors face financial constraints connected with sanctions risks and difficulties in cross-border payments, which makes them cautious about large long-term projects. So it is very important to improve its quality and change sectoral orientation for the transition to joint production.
The analysis points to a few directions worth pursuing in Russian-Chinese cooperation. First, it is necessary to push exports of processed goods and set up joint production, especially in raw material processing, agriculture, and forestry, where Chinese investors have already shown real interest. Countries should building transport and logistics in the Far East and the border regions that would ease some of the infrastructure constraints. Continuously, expanding settlements in national currencies and fixing up payment mechanisms would cut down sanctions-related risk. And finally, regional investment policy should target the areas that score highest on the Russian-Chinese investment index so that Chinese money can end up in higher value-added projects.
Taking all the above into account, we would like to say that trade between Russia and China is growing. Nevertheless, the expected value of trade turnover is slightly overestimated, but if stimulating measures are implemented, the two countries may reach the expected value by 2030. It is also essential for both countries to consider a transition from cooperation primarily focused on raw materials toward joint production, technological exchange, and investment in regional development.
References:
1. Investment index showed the map of cooperation between the economies of Russia and China [Electronic resource]//Eurasian Analytical Alliance. URL: https://www.eaab.ru/tpost/i81c636561-investitsionnii-indeks-pokazal-kartu-sot (Date accessed: 20.10.2026).
2. Investment index showed the map of cooperation between the economies of Russia and China [Electronic resource]//Eurasian Analytical Alliance. URL: https://www.eaab.ru/tpost/i81c636561-investitsionnii-indeks-pokazal-kartu-sot (Date accessed: 20.10.2026).
3. M. Chernyaev, M. Russia and China: Bilateral Relations in the Context of the Formation of a Multipolar World//Russian International Affairs Council.-April 9, 2025.-URL: https://russiancouncil.ru/analytics-and-comments/analytics/rossiya-i-kitay-dvustoronnie-otnosheniya-v-usloviyakh-formirovaniya-mnogopolyarnosti/ (Date accessed: 11.10.2026).
4. National Bureau of Statistics of China. Total stock of foreign direct investments from China in Russia between 2014 and 2024 (in billion U.S. dollars) [Electronic resource]//Statista. URL: https://www.statista.com/statistics/721964/outward-fdi-stock-from-china-to-russia/ (Date accessed: 15.10.2026).
5. Reshetnikov Sees $300 Billion Trade Target Between Russia and China as Achievable//TASS.- September 26, 2025.- URL: https://tass.ru/ekonomika/25169233 (Date accessed: 11.10.2026).
6. Russia–China trade turnover decreased by 7 % to 228 billion dollars in 2025 [Electronic resource]//Infranews. 20.01.2026. URL: https://www.infranews.ru/vneshnyaya-torgovlya/69477-tovarooborot-rossii-i-kitaya-po-itogam-2025-goda-sokratilsya-na-7-do-228-mlrd-dollarov/ (Date accessed: 13.10.2026).
7. Statista Research Department. Value of Russian trade in goods (export, import, and trade balance) with China from 2007 to 2024 [Electronic resource]//Statista. URL: https://www.statista.com/statistics/1003171/russia-value-of-trade-in-goods-with-china/ (Date accessed: 13.10.2026).
